This is what central london postcodes look like.
After getting data from one of the popular UK property listing website starting with Z, I had a look at the stock of residential homes in Central London. I define central London to be postcodes EC1, EC2, EC3, EC4, WC1 and WC2 - only because they include ‘C’ in the postcode 😂 (perhaps I should include W1 too?). The analysis is done in R using tidyverse and ggplot2. If you have the data, you can reproduce this analysis using this Rmd on my Github.
I have found 40742 properties across 3333 postcodes. These include all properties regardless if they have been sold or not. This does not seem like a lot of properties for me, since if there are 2-4 people per property, it implies a Central London population of only 80 - 150k. Given this caveat, lets analyse what kind of properties occur within these postcodes.
|
|
This are the attributes we have about each of property
## $streetAddress
## [1] "Flat 9, 7 Leonard Street"
##
## $addressLocality
## [1] "London"
##
## $addressRegion
## [1] "London"
##
## $postalCode
## [1] "EC2A 4AN"
##
## $property_id
## [1] 29018326
##
## $longitude
## [1] -0.08705
##
## $latitude
## [1] 51.5248
##
## $amenities
## [1] "Flat, Leasehold"
##
## $features
## [1] "2 bed flat\n1 bed flat\nOne bedroom\nOne bathroom\nOpen plan kitchen/living area\nBalcony\nSecond floor\nGreat local amenities\nClose to station\nApprox 477 sq ft\nCompletion April 2013\n3 bed property"
##
## $desc
## [1] "Property description\nKey features:\n• 2 Bedrooms\n• 1 Shower room\n• First floor\n• Lift\n• 24 hour concierge\n• Gym\nA first floor two bedroom apartment located on Leonard Street close to Old Street Underground Station. The apartment measures approximately 750sqft and comprises of a spacious living room and dining room, a very spacious modern kitchen, two double bedrooms which are not adjacent to one another and modern shower room. This development benefits from the use of Bezier facilities: 24 hour concierge, gym, sauna, steam room and communal terrace. This property would be ideal for a professional couple who want easy access to the City.\nA one bedroom apartment on the second floor of the new Leonard Street development in the heart of the Old Street area. Perfectly placed to take full advantage of everything on offer in this prime location, the property boasts double bedroom, large open plan kitchen and living area, bathroom and balcony. The development offers 24 hour concierge. The apartments have been beautifully designed benefitting from under flooring heating and comfort cooling. Ideally located within walking distance to Old Street tube station, moments from High Street shopping, boutiques, markets, bars & restaurants. Approx 477 sq ft. Estimated completion April 2013.\nDestined to become a prestigious central London address for a few discerning individuals. Behind this elegant red brick facade, a meticulous conversion has given rise to a fabulous range of chic one, two and three bedroom apartments. Perfectly placed to take full advantage of everything on offer in the prime location, ecity represents a great opportunity to buy into a piece of London's heritage."
##
## $floorplan
## [1] NA
##
## $broadband
## [1] NA
##
## $beds
## [1] 1
##
## $area
## [1] 477
##
## $is_flat
## [1] TRUE
##
## $is_leasehold
## [1] TRUE
##
## $zest
## [1] NA
Missing data
Percent of data missing by name of the column.
| missing_info | |
|---|---|
| streetAddress | 0.00 |
| addressLocality | 0.00 |
| addressRegion | 0.00 |
| postalCode | 0.00 |
| property_id | 0.00 |
| longitude | 0.00 |
| latitude | 0.00 |
| amenities | 0.20 |
| features | 0.91 |
| desc | 0.91 |
| floorplan | 0.98 |
| broadband | 0.98 |
| all\_desc | 0.91 |
| beds | 0.75 |
| area | 0.97 |
| is\_flat | 0.00 |
| is\_leasehold | 0.00 |
| zest | 0.73 |
We are missing basic information in amenities for around 20% of the
data. This is because sometimes land registry does not have this data if
the property has never been sold or is very old.
We are also missing description (and features), floorplan etc of most of the properties since we only retain that information from sales and rent listings. We will see later that a very small % of stock is actually resold each year.
Finally, the current value estimate as determined by the website is only available for 73% of the houses. This is still impressive because we do not even know the number of beds of a property for 75% of the properties!
Property Characteristics
What do the properties in this area look like ?
|
|
##   is_flat        is_leasehold         beds            area             zest
##  Mode :logical   Mode :logical   2      : 5625   Min.   :  50.0   Min.   :  271500
##  FALSE:9796      FALSE:11994     3      : 1766   1st Qu.: 523.0   1st Qu.:  584500
##  TRUE :30946     TRUE :28748     1      : 1247   Median : 750.0   Median :  768000
##                                  0      :  854   Mean   : 887.7   Mean   :  862168
##                                  4      :  440   3rd Qu.:1000.0   3rd Qu.:  980500
##                                  (Other):  258   Max.   :4829.0   Max.   :11525000
##                                  NA's   :30552   NA's   :39650    NA's   :29750
Total value
The property stock with estimates is worth a total of £9,477m. Since 73% is missing, this would imply the whole residential stock to be £35,110m. This is probably grossly underestimated as zest is not calculated for the most expensive properties, especially new builds.
TL;DR: Properties by bed by postcode
How many properties exist in each postcode area ?
|
|
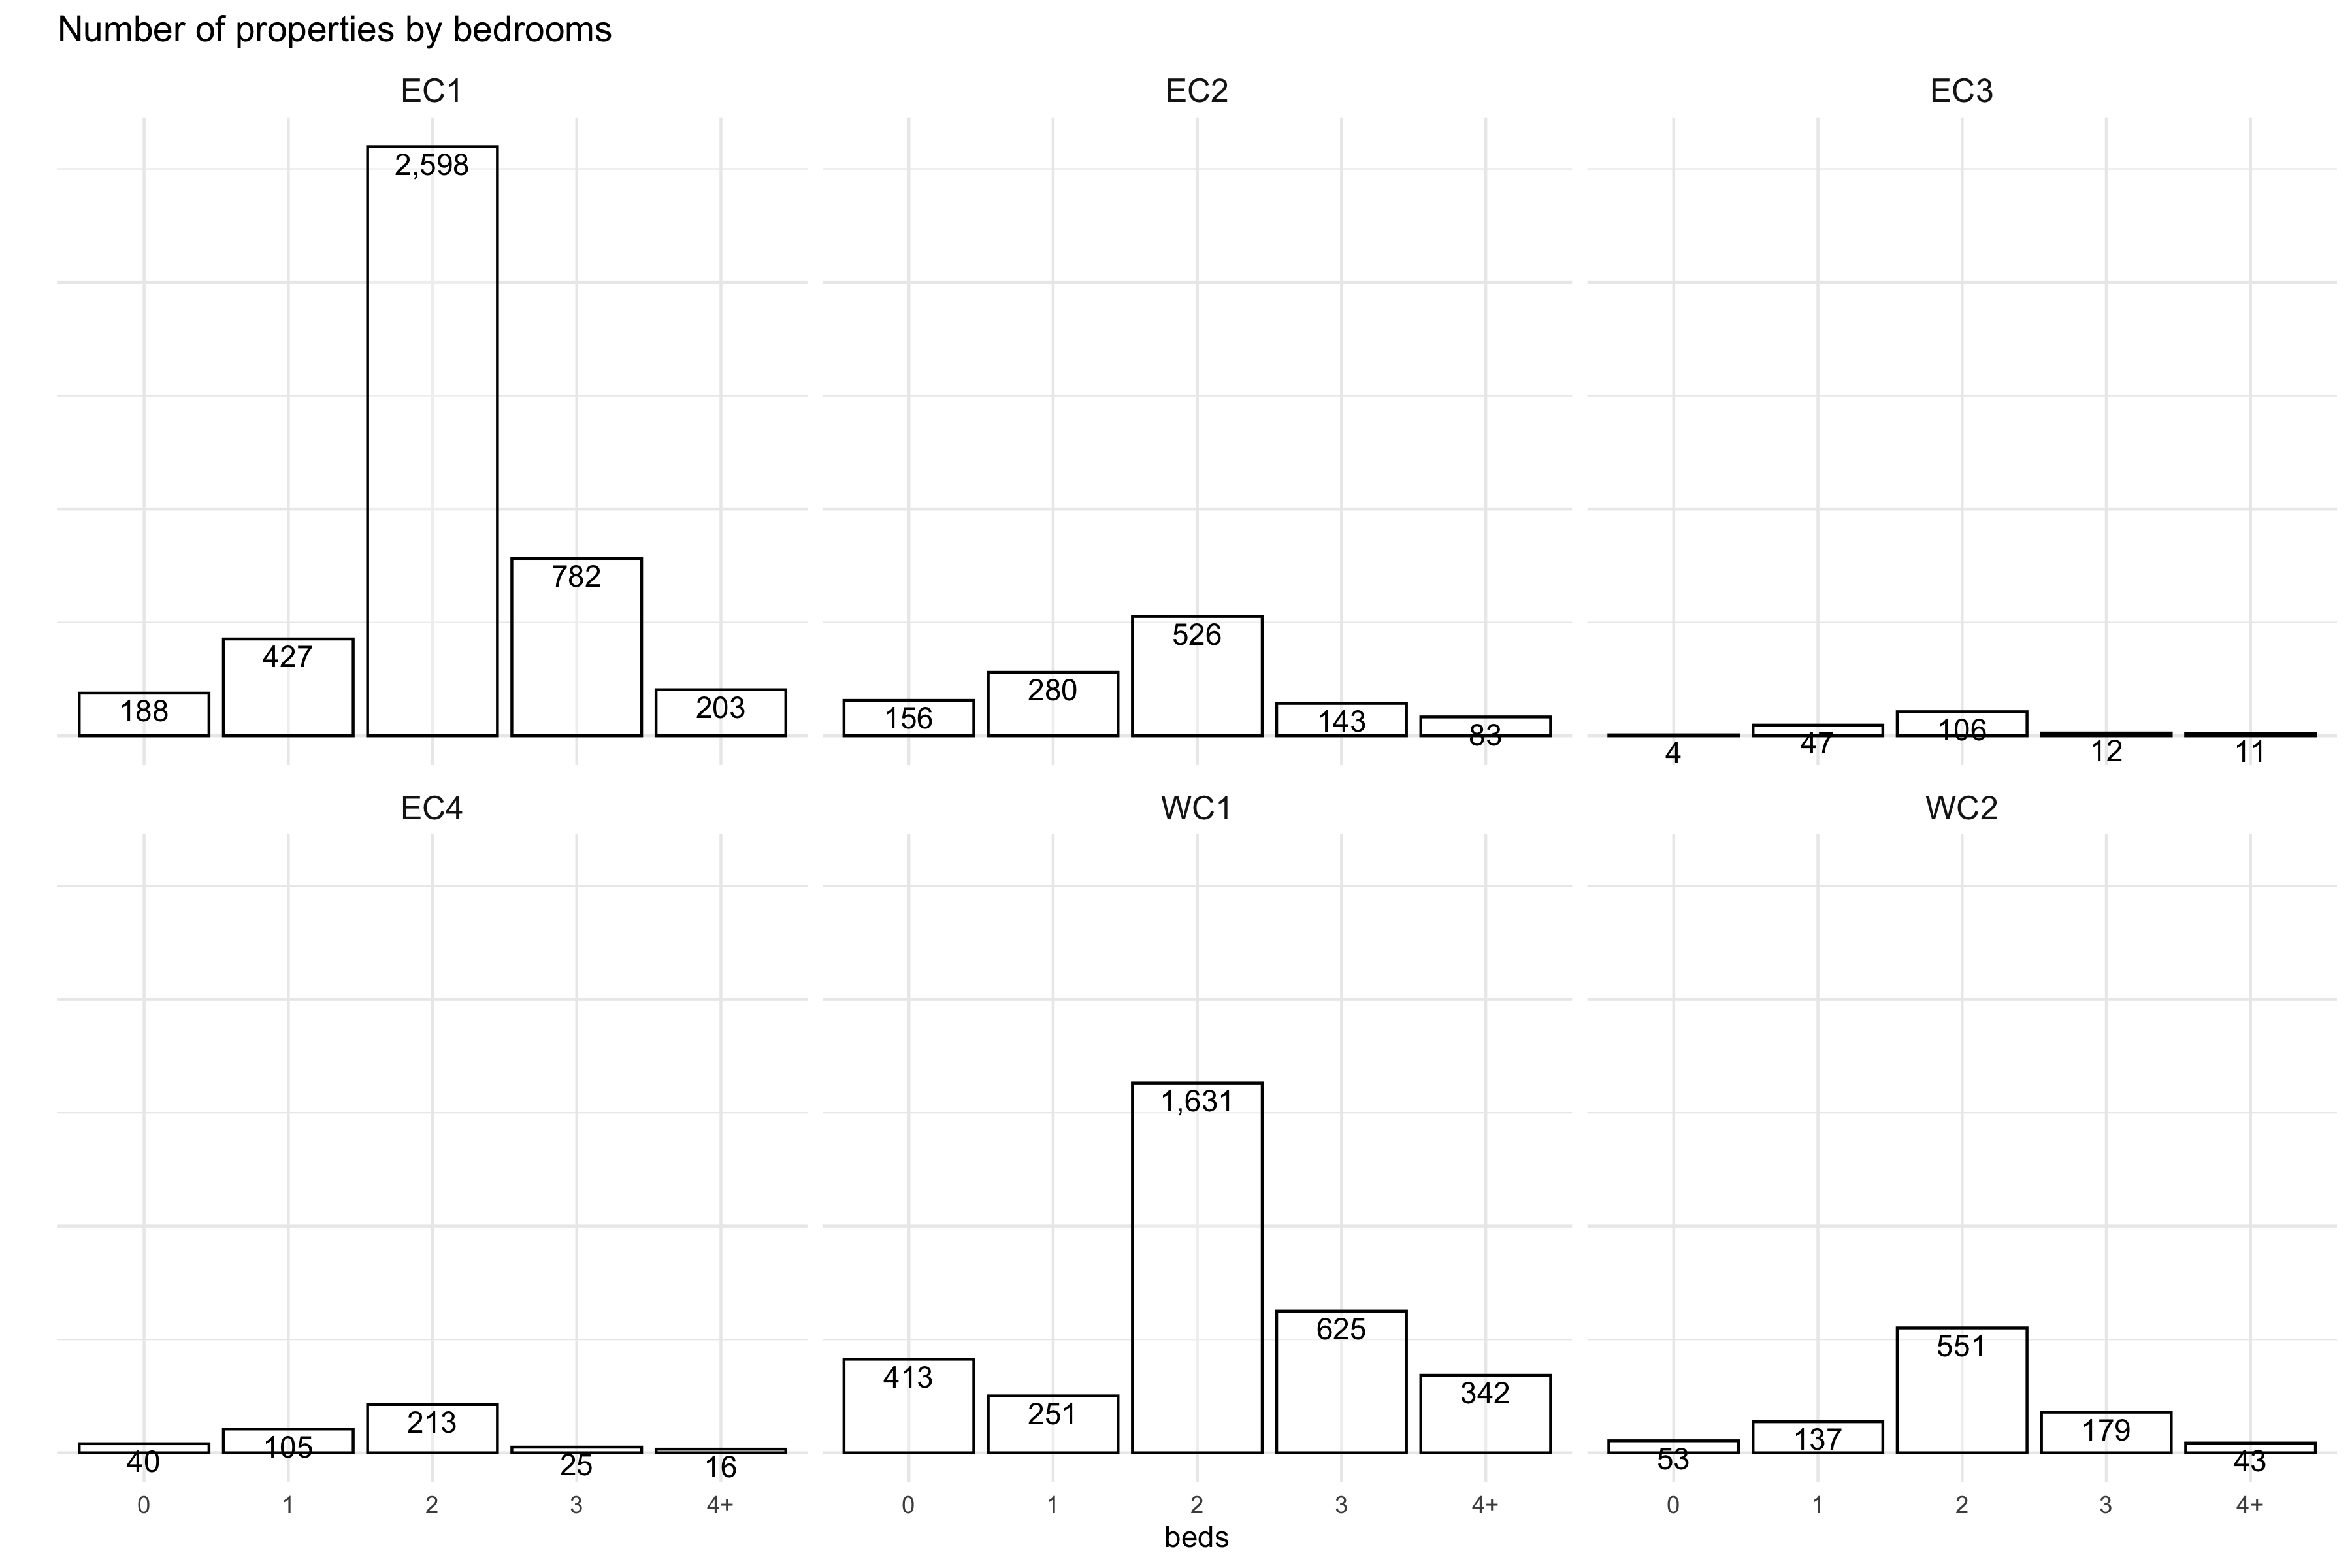
There are a very high number of properties in EC1, even though WC1 is approximately the same size in area. There is barely any housing in EC3 and EC4. Walking around EC3 and EC4, there are a lot of high rises, and looks like they are all offices.
There are some other interesting differences in the distribution of number of beds within postcodes. There are a lot less two beds in WC1 compared to EC1. The number of 2 beds in EC1 is surprisingly very high. Anecdotally, I have seen a lot of builds in the EC1 area advertising a very high amount of 2 bedrooms. I wonder if this is causing a weakness in the market for 2 beds.
Next, lets plot the area of each house by bed.
TL;DR: Internal area by beds
Caveat Only 1000/40,000 properties have the area attribute, so below could be very unrepresentative. I will have to scrape the EPC ratings to get the area of all properties. Still, its interesting to see the trends area.
|
|
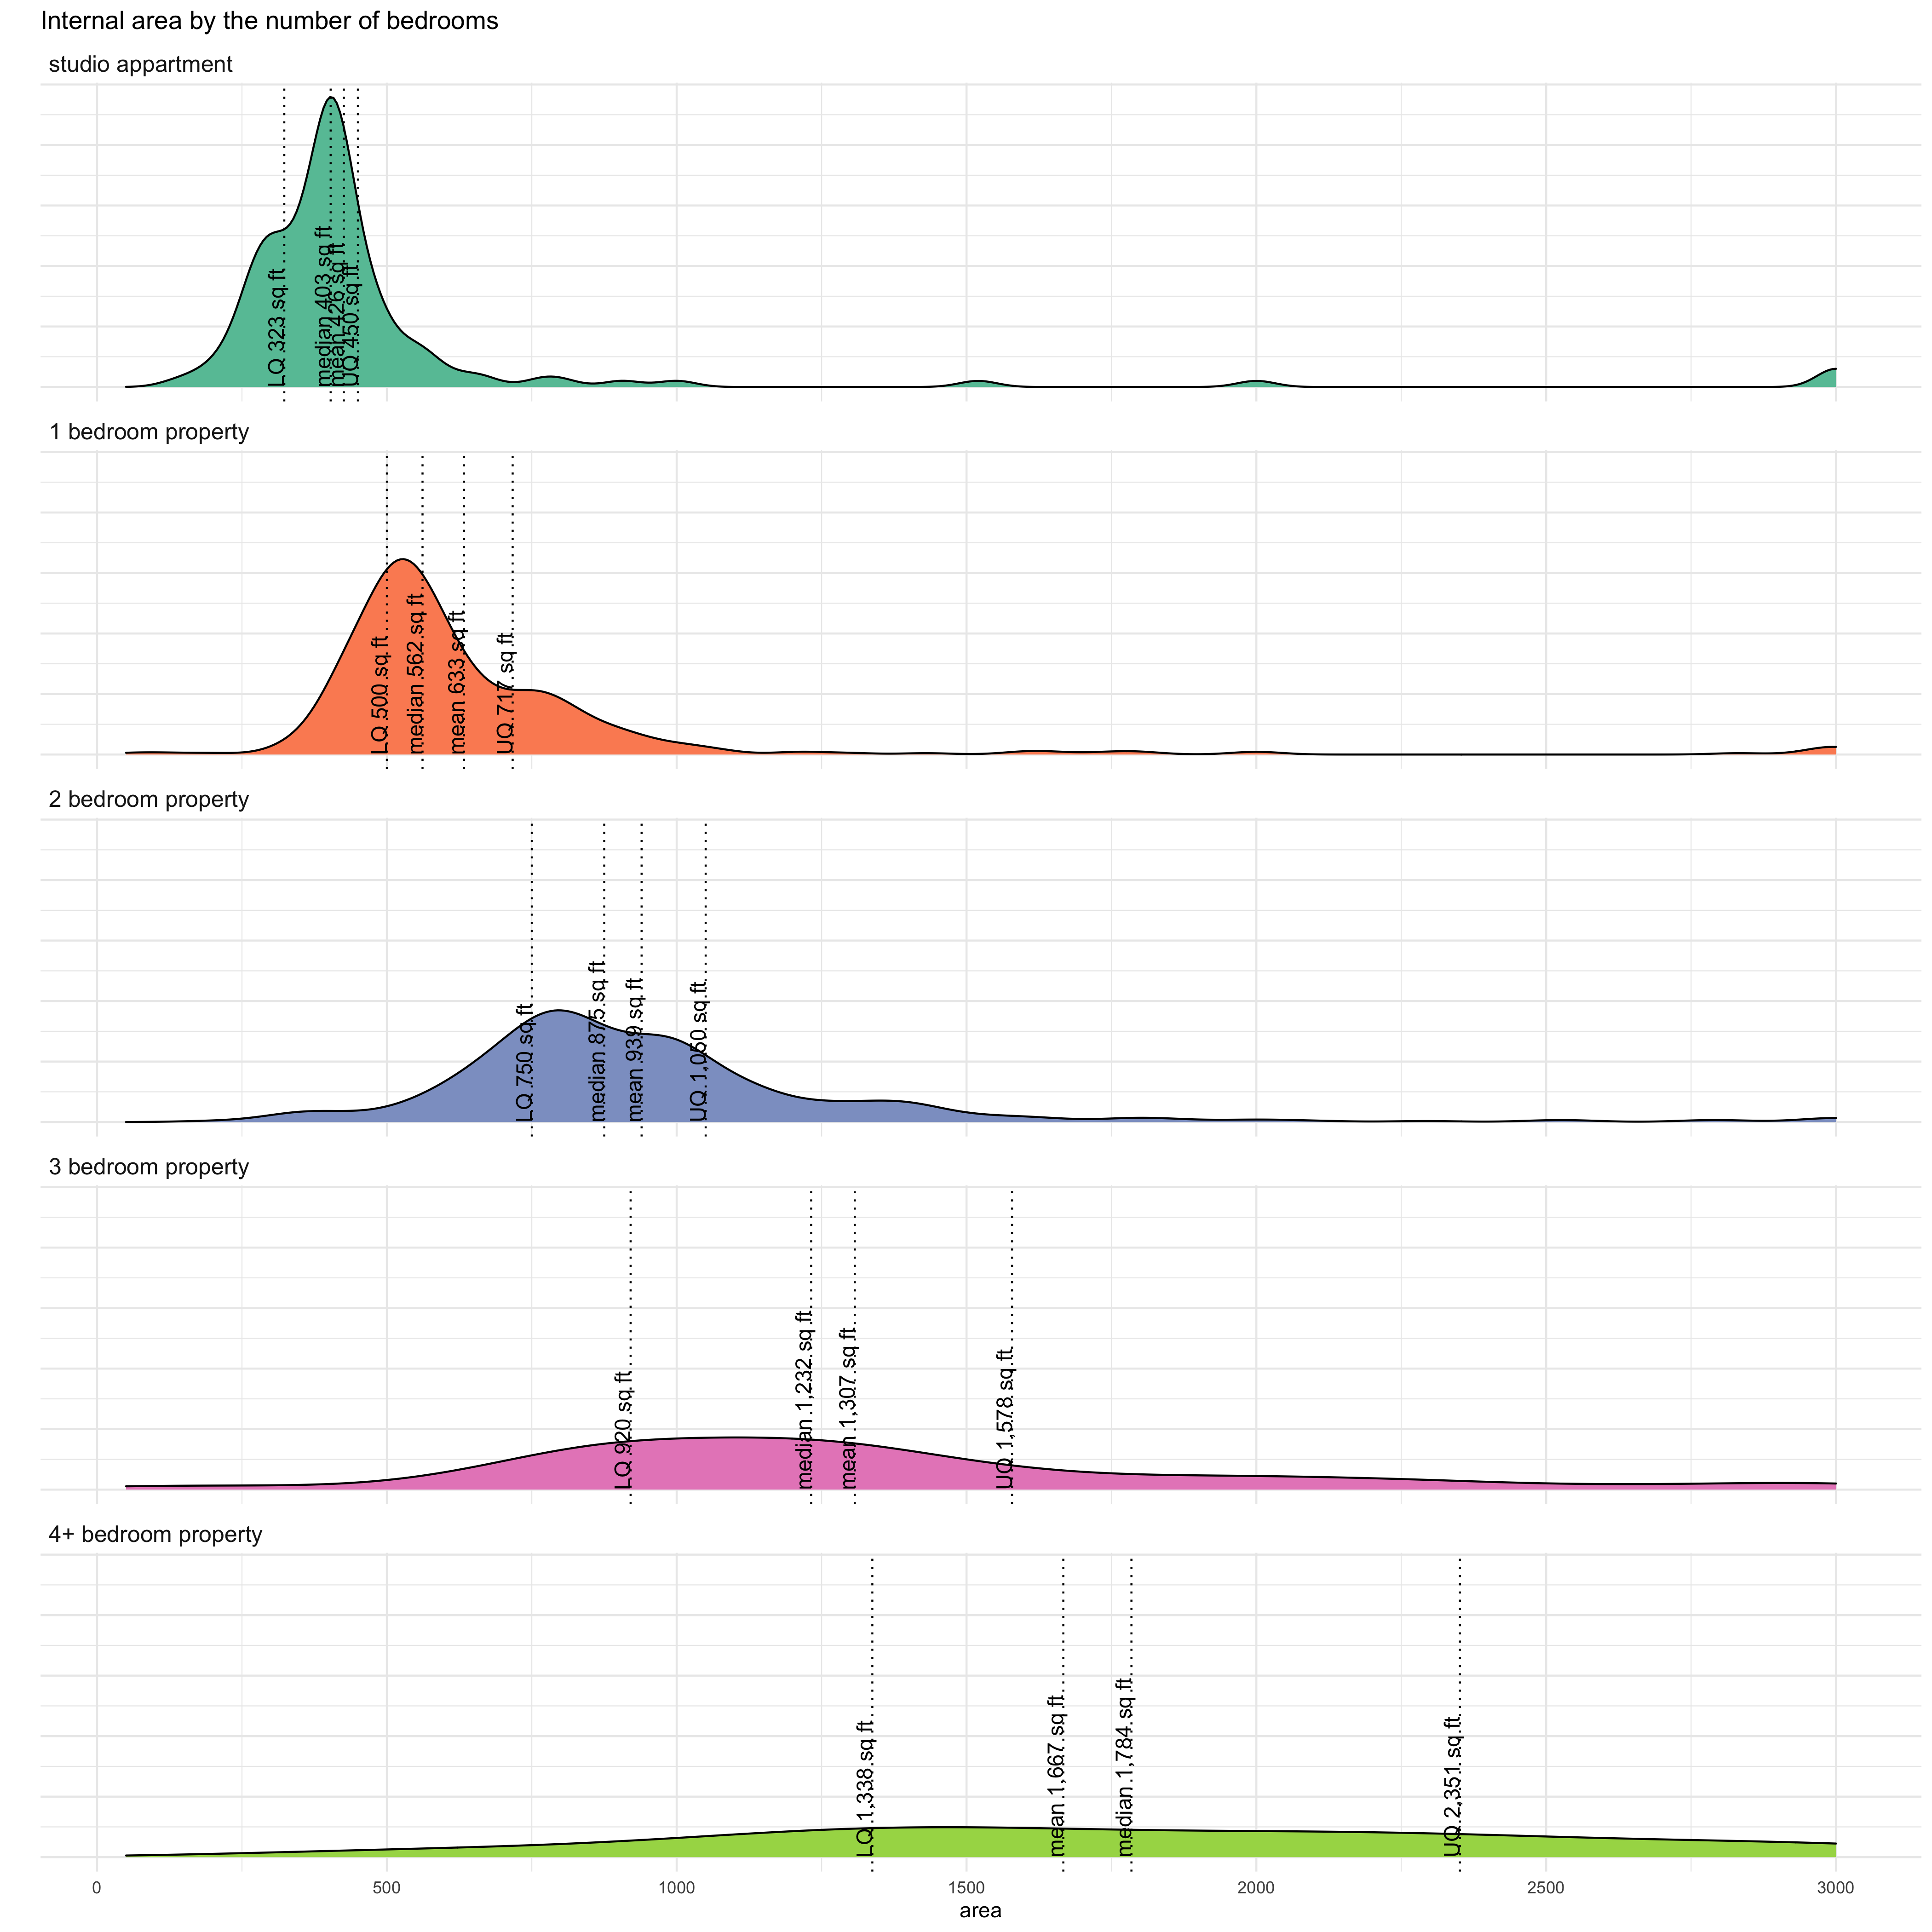 As expected the distribution of the house area shifts to the right as
number of bed rooms increases. It is also interesting that it becomes
flatter, implying that the variability of the properties within the
‘bedrooms’ increases as we add more bedrooms. Hence, the properties
become more individual.
As expected the distribution of the house area shifts to the right as
number of bed rooms increases. It is also interesting that it becomes
flatter, implying that the variability of the properties within the
‘bedrooms’ increases as we add more bedrooms. Hence, the properties
become more individual.
Next steps
-
Perhaps I will include W1, W1 and SW1 in the analysis, but they don’t occur to me as central.
-
Get internal area for more properties (scrape the EPC certificates?)